In this guide, you'll learn the formula, how to calculate it overall and per dish, what benchmark to target, and actionable ways to bring it down.
TLDR
- Food cost percentage = (COGS ÷ Total Food Sales) × 100; the industry benchmark is 28–35%
- COGS = Opening Inventory + Purchases – Closing Inventory
- Per-dish food cost percentage = (Ingredient Cost per Serving ÷ Selling Price) × 100
- A food cost percentage above 35% demands a pricing, portion, or purchasing review
What Is Food Cost Percentage?
Food cost percentage measures the share of a restaurant's revenue that goes toward the cost of the ingredients used to produce menu items — not labor, not rent, just food goods. It's expressed as a ratio of Cost of Goods Sold (COGS) to total food sales. The percentage view benchmarks performance regardless of restaurant size — and that distinction matters more than most operators expect.
Why Percentage Matters More Than Raw Dollars
A restaurant spending $8,000 on food in a month sounds expensive, but if that kitchen generated $25,000 in food sales, the 32% food cost percentage is healthy. Another restaurant spending only $5,000 on food but earning just $12,000 in sales has a 42% food cost percentage — a red flag despite the lower absolute spending.
What Food Cost Percentage Does Not Include:
- Alcohol or beverage costs (tracked separately as "pour cost")
- Paper goods, disposables, or packaging
- Labor costs (wages, benefits, payroll taxes)
- Rent, utilities, or overhead
How to Calculate Food Cost Percentage for Your Restaurant
Calculating food cost percentage is a two-step process: first determine your Cost of Goods Sold (COGS), then apply the food cost percentage formula. You'll need inventory counts from at least one week apart to get an accurate figure.
Gathering Your Four Key Numbers
You need four inputs:
- Opening Inventory: Dollar value of all food stock at the start of the period
- Purchases: All food restocking costs during the period (from invoices)
- Closing Inventory: Dollar value of remaining stock at period end
- Total Food Sales: Food revenue only, from POS reports (exclude alcohol)
Tracking Frequency Tip:Monthly calculations are the industry standard. However, weekly tracking gives faster feedback for high-volume operations and catches problems like portion drift or theft before they erode your margins.
The COGS Formula
COGS = Opening Inventory + Purchases – Closing Inventory
Example:
- Opening Inventory: $4,000
- Purchases during month: $6,000
- Closing Inventory: $3,500
- COGS = $4,000 + $6,000 – $3,500 = $6,500
The Food Cost Percentage Formula
Food Cost % = (COGS ÷ Total Food Sales) × 100
Continuing the example above:
- COGS: $6,500
- Total Food Sales: $18,000
- Food Cost % = ($6,500 ÷ $18,000) × 100 = 36.1%

A 36.1% food cost percentage exceeds the 28–35% industry benchmark — the restaurant is spending too much on ingredients relative to revenue and needs to act on pricing, portions, or supplier costs.
⚠️ Critical Reminder: Exclude alcohol and non-food items from COGS. Including beverages artificially inflates your food cost percentage and distorts decision-making.
How to Calculate Food Cost Per Dish
Overall food cost percentage tells you if the kitchen is profitable, but per-dish analysis reveals which specific menu items are profit drivers and which are actively losing money. This granular view informs smarter menu engineering decisions.
The Per-Dish Formula
Food Cost % Per Dish = (Cost of Ingredients per Serving ÷ Selling Price) × 100
This covers every ingredient in that dish — garnishes, oils, and seasoning included — scaled to one portion.
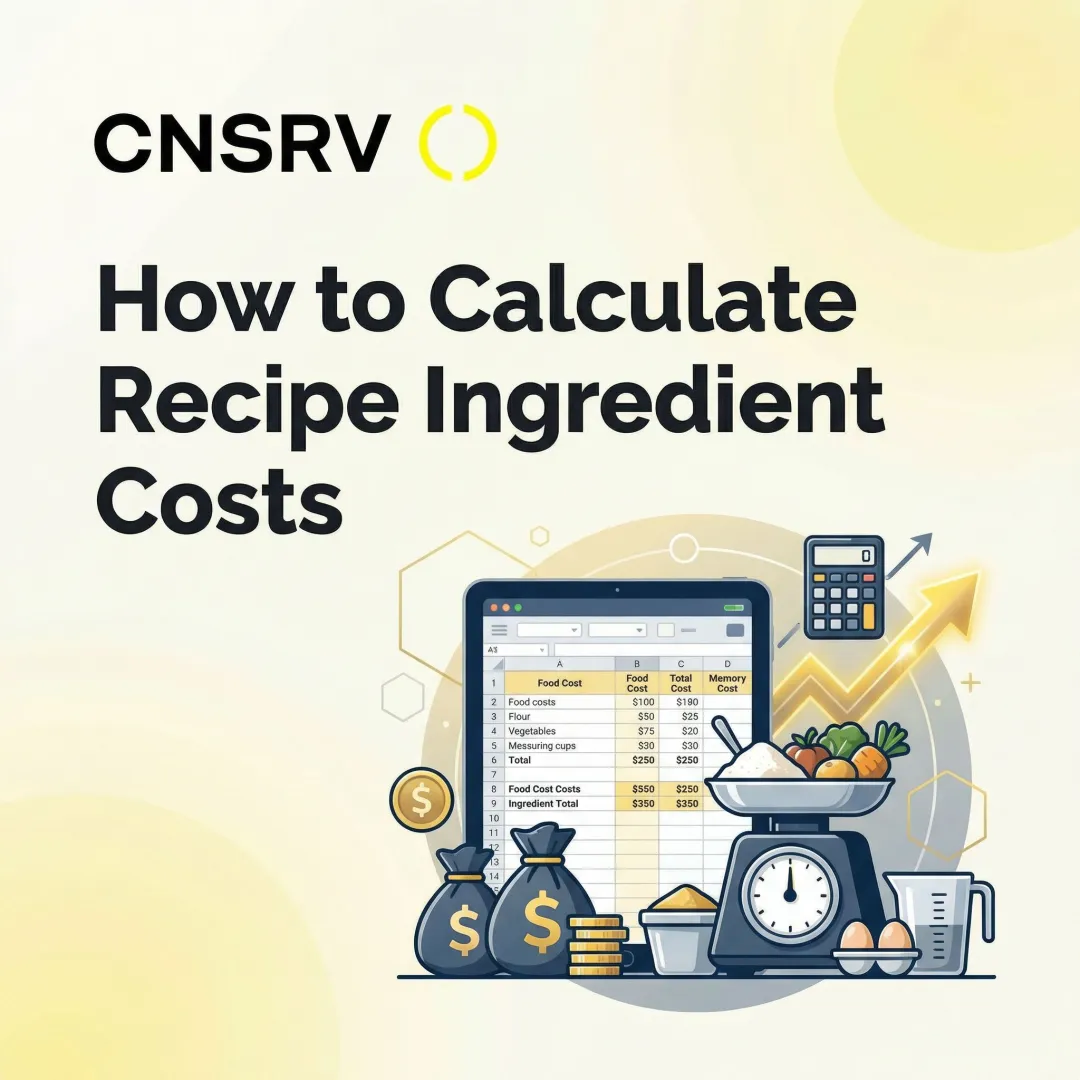
Worked Example: Cost Per Serving Breakdown
Let's calculate the food cost for a pasta primavera:
| Ingredient | Quantity per Serving | Cost per Unit | Ingredient Cost ||------------|---------------------|---------------|-----------------|
| Penne pasta | 6 oz | $0.12/oz | $0.72 || Mixed vegetables | 4 oz | $0.18/oz | $0.72 || Olive oil | 1 oz | $0.25/oz | $0.25 || Parmesan cheese | 1 oz | $0.40/oz | $0.40 || Garlic & herbs | — | — | $0.15 || Total Recipe Cost | | | $2.24 |
If this pasta sells for $12.00:
- Food Cost % Per Dish = ($2.24 ÷ $12.00) × 100 = 18.7%
This 18.7% per-dish food cost is excellent — well below the 28–35% target — making this pasta a high-margin menu item.
Not every popular dish earns its place on the menu. If a crowd-favorite shows a 55% food cost percentage, it's a liability regardless of how often it sells. Options include:
- Reduce portion size slightly
- Substitute a less expensive ingredient
- Increase the selling price
- Reposition it as a premium item with higher pricing
Once you've addressed problem items, tracking per-dish costs over time keeps you ahead of ingredient price volatility. If your seafood pasta jumps from 32% to 48% food cost, seasonal price spikes will likely call for temporary menu adjustments or supplier changes.
What Is a Good Food Cost Percentage for a Restaurant?
The industry standard range is 28–35%, with 30% widely adopted as a target that balances profitability with quality.
However, the "right" food cost percentage varies by restaurant type:
| Restaurant Type | Typical Food Cost Range | Notes |
|---|---|---|
| Quick Service (QSR) | 20–28% | High volume requires tighter margins |
| Fast Casual | 25–30% | Higher quality than QSR, limited service |
| Casual Dining | 25–30% | Industry standard range |
| Fine Dining | 30–38% | Premium ingredients offset by higher menu prices |
| Pizza | 15–20% | Lowest food cost due to inexpensive bulk ingredients |

2024 National Restaurant Association data shows median food cost percentages of 32.4% for limited-service and 32.0% for full-service operations, confirming that a single 30% target doesn't hold across all restaurant types.
Food Cost Alone Doesn't Tell the Whole Story
That's why food cost percentage is best evaluated alongside labor cost. Together, these two expenses form Prime Cost (Food + Labor) — the most reliable indicator of restaurant profitability.
A restaurant running 32% food cost with lean labor can still be highly profitable. A 28% food cost paired with 40% labor cost is a problem. Target a prime cost of 55–60% of total sales; once it exceeds 65%, the operation is typically unprofitable.
5 Proven Strategies to Reduce Your Restaurant's Food Cost Percentage
1. Conduct Regular, Accurate Inventory Counts
The foundation of food cost control is knowing exactly what you have. Sporadic or inaccurate inventory leads to over-purchasing, spoilage, and a distorted food cost percentage.
Why weekly beats monthly:Weekly inventory tracking catches "recipe drift" and waste immediately, whereas monthly tracking leaves too much time for costly problems to compound. High-performing restaurants aim for Actual vs. Theoretical (AvT) variance of 1.5–3% for QSR and 3–5% for full-service; variances above these levels indicate theft, waste, or portioning errors.
2. Standardize Recipes and Portion Sizes
Written, standardized recipes ensure every dish uses a consistent, costed amount of each ingredient — eliminating portion creep that silently inflates food costs.
A variance of just 1 ounce of meat on 100 dishes a week can cost a restaurant nearly $4,000 annually. Use scales, ladles, and color-coded scoops to enforce standardized specs.
Recipe costs must also account for oils, butter, seasonings, and garnishes. For items difficult to measure per dish — salt, fry oil, spices — add a "Q-Factor" (typically 1–5% of food cost) to the recipe cost.
3. Negotiate with Suppliers and Monitor Market Prices
Purchase data derived from COGS tracking gives you leverage in supplier negotiations. Two tactics deliver the most impact:
- Consolidate vendors — Hitting volume tiers with fewer suppliers can reduce food costs by 8–15%. Standardizing specs (for example, one chicken breast cut across multiple dishes) increases buying power and cuts waste.
- Negotiate prime vendor agreements — For high-usage items, lock in tiered rebates (0.25%–0.75% based on annual spend). Historical purchase data proves loyalty and supports better terms.
4. Reduce Waste Across the Kitchen — Including Overlooked Utility Waste
Food waste directly raises COGS. The USDA estimates the restaurant industry loses approximately $162 billion annually to wasted food, with the average restaurant generating 25,000 to 75,000 pounds per year.
Approximately 70% of foodservice waste is plate waste — food served but not eaten. Offering smaller or customizable portions reduces this directly, and 60% of consumers already prefer flexible portion options.
A less visible cost driver sits in the prep station. Many kitchens thaw frozen proteins under continuously running faucets, wasting thousands of gallons monthly. Standard commercial faucets flow at 2.2 gallons per minute, meaning a single faucet running one hour daily wastes over 130 gallons — and FDA Food Code 3-501.13 still requires that method to maintain 70°F or below with sufficient water velocity.
CNSRV's closed-loop defrosting system uses 98% less water than running-faucet thawing and can save up to 1,000,000 gallons per year per kitchen. That reduction in water use cuts utility bills — some restaurants save over $2,000 in the first month — while maintaining full FDA compliance.
5. Engineer Your Menu Around Profitable Items
Use per-dish food cost analysis to spotlight high-margin dishes, reduce or reprice low-margin items, and guide menu layout decisions.
Focus on contribution margin:Contribution margin (the total gross profit dollars) matters more than food cost percentage alone. A steak with a 35% food cost may generate more actual profit dollars than a pasta dish with a 20% food cost.
Menu psychology:
- Remove dollar signs (for example, "20" instead of "$20.00") to reduce price sensitivity
- Highlight high-margin "Star" items with boxes, photos, or prime page placement
- Use descriptive language to justify premium pricing on profitable dishes
- Group low-margin items away from visual focal points so they don't anchor ordering decisions
Frequently Asked Questions
How do you calculate food cost percentage?
Food Cost % = (COGS ÷ Total Food Sales) × 100. COGS is derived from Opening Inventory + Purchases – Closing Inventory. Exclude alcohol and non-food items to avoid inflating the percentage.
What is considered a good food cost percentage?
The industry benchmark is 28–35%, with 30% a common target. Quick-service restaurants typically operate at 20–28%, while fine dining may tolerate up to 38% due to premium ingredients and higher menu prices.
What is COGS in a restaurant?
Cost of Goods Sold (COGS) is the total cost of ingredients consumed during a period, calculated from inventory counts. It excludes labor, overhead, and non-food expenses — only direct ingredient costs count.
How often should I calculate food cost percentage?
Monthly is the standard minimum for most restaurants. Weekly tracking is beneficial for high-volume or cost-stressed operations, as it catches problems like theft, waste, or price spikes before they compound.
What is food cost per portion?
Portion (per-dish) food cost is the sum of ingredient costs in one serving divided by its selling price, expressed as a percentage. It helps you identify which menu items are profitable and which are margin drains.
How can I lower my restaurant's food cost percentage?
Several levers can bring costs down:
- Standardize recipes and enforce consistent portion control
- Reduce waste — including water used during food defrosting
- Renegotiate supplier terms or consolidate purchasing
- Use per-dish cost data to engineer a more profitable menu
Target a prime cost (food + labor combined) of 55–60% for overall profitability.