While the concept seems simple—add up ingredient costs—accuracy is significantly impacted by yield loss, hidden operational costs, portion inconsistency, and outdated pricing. Most operators systematically underestimate their true food costs because they overlook these variables. The result? Menu prices that don't cover actual costs, margins that erode silently, and profitability that disappears before it shows up on the P&L.
This guide covers a clear step-by-step process for calculating recipe cost, the key variables that affect accuracy, and the most common mistakes to avoid.
TL;DR
- Recipe costing calculates the true cost of every ingredient in a dish, down to the edible portion used—not just purchase price
- AP cost and EP cost are the two foundational concepts—confusing them is the most expensive mistake operators make
- Accurate costing requires yield testing, sub-recipe costing, and tracking hidden costs like garnishes and overhead
- Recipe costs must be updated regularly as supplier prices fluctuate—static numbers lead to margin erosion
- Digital costing tools reduce manual errors and keep costs current in real time
What Is Recipe Costing and Why It Matters
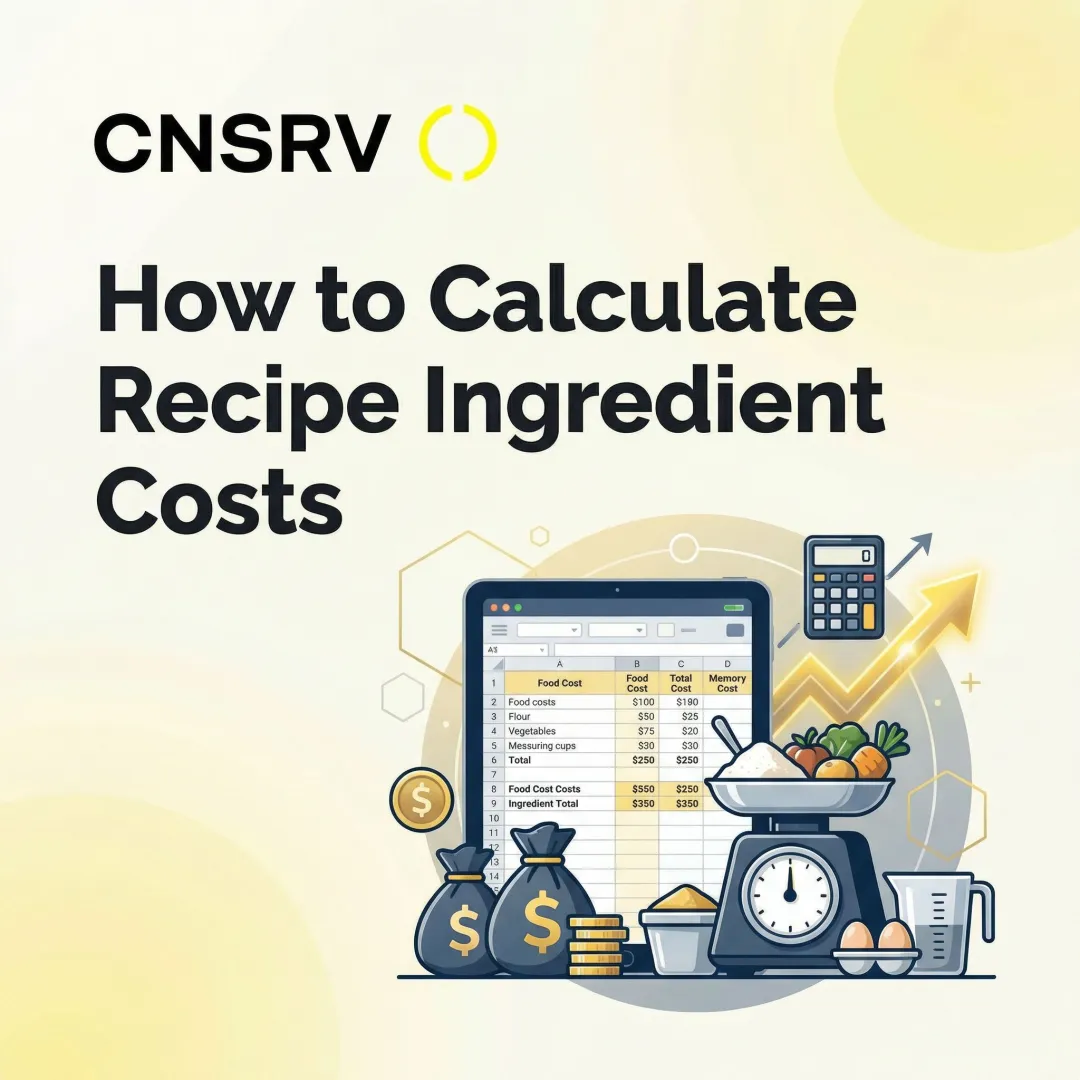
Recipe costing is the process of calculating the exact cost of every ingredient that goes into a single dish at the portion size served—not an estimate, but a precise per-serving number. This figure becomes the foundation for two critical business outcomes: setting a menu price that covers costs and achieves your target profit margin, and identifying which menu items are unprofitable before they drain resources.
According to the National Restaurant Association's 2025 Operations Data Abstract, median food cost percentages in 2024 broke down as follows:
| Concept Type | Food Cost % |
|---|---|
| Limited-service (median) | 32.4% |
| Full-service (median) | 32.0% |
| Full-service, $2M+ in sales | 31.0% |
| Full-service, lower volume | 33.7% |
Quick-service concepts typically run leaner than fine dining, but these figures set the target range most operators work toward—and recipe costing is the mechanism for getting there.
In 2025, 42% of operators reported their businesses were unprofitable, largely due to cost pressures. For a 25-unit brand generating $2.5M per location, a 1% variance between actual and theoretical food cost equals $625,000 in lost annual EBITDA. Reducing food cost by just 3% can save over $300,000 annually for a multi-unit group. Accurate recipe costing is where that margin recovery starts.
How to Calculate Recipe Cost: Step by Step
Step 1: Standardize Your Recipe First
You cannot cost a recipe that changes between services. Standardized recipes with locked measurements, portion sizes, and procedures are the non-negotiable foundation. If two cooks serve different portion weights, the plate cost variance can be significant—and your costing exercise becomes meaningless.
A standardized recipe card includes:
- Complete ingredient list with exact quantities by weight or volume
- Detailed prep instructions that don't vary
- Total yield and number of portions
- Specific cooking times and temperatures
- Portioning tools required (scales, scoops, ladles)
Lock these elements before you start costing. Without consistency in execution, cost data has no foundation to stand on.
Step 2: Determine As-Purchased (AP) Cost Per Unit
AP cost is the price paid per unit—per pound, per liter, per each—as it appears on your supplier invoice. This is your starting point for every ingredient.
Calculate cost per unit from bulk purchases by dividing total cost by total quantity. If a 5 lb bag costs $15.00, the cost per pound is $15.00 ÷ 5 = $3.00.
This step requires current invoice data, not estimates. Using last month's pricing or guessing at costs introduces error from the start.
Critical: AP cost is not your final ingredient cost. It's only the beginning.
Step 3: Run a Yield Test and Calculate Edible Portion (EP) Cost
EP cost is the cost of the ingredient after trimming, peeling, butchering, or cooking—what actually ends up on the plate. 100% yield is never realistic. Proteins lose moisture during cooking, produce has peels and cores, and fish arrives with bones and skin.
Yield test formula:
- Yield % = (EP Weight ÷ AP Weight) × 100
- EP Cost = AP Cost ÷ Yield % (in decimal form)
Example: You purchase a 10 lb ribeye at $12.00/lb (AP Cost = $12.00). After trimming fat and cooking, you have 6.3 lbs of usable meat.
- Yield % = (6.3 ÷ 10) × 100 = 63%
- EP Cost = $12.00 ÷ 0.63 = $19.05/lb

The true cost of that ribeye is $19.05 per pound, not $12.00. Pricing your menu based on AP cost would understate your food cost by nearly 60%.
That gap is largest with proteins, which take the biggest hit from trimming and cooking loss. USDA yield data puts trimmed ribeye at 63%, baked chicken breast at 72%, and cooked beef tenderloin at 75%. Produce varies too—broccoli yields only 61%, while peeled potatoes come in at 85%.
Step 4: Cost Sub-Recipes and Batch Items
Sauces, stocks, dressings, and other batch-prepared components need their own cost-per-unit calculation before being rolled into a parent recipe. The formula is:
Unit Cost = Total Ingredient Cost ÷ Batch Yield
Example: You make a batch of house vinaigrette. The total ingredient cost (olive oil, vinegar, mustard, shallots, herbs) is $18.50. The batch yields 128 ounces.
- Cost per ounce = $18.50 ÷ 128 = $0.14/oz
When a salad recipe calls for 2 oz of vinaigrette, you add $0.28 to the plate cost. Treating batch items as "free" or rolling them into overhead quietly inflates food cost across every menu item that uses them.
Step 5: Build the Recipe Card and Apply the Q-Factor
Once EP costs for all components are calculated, the total plate cost is the sum of each ingredient's (EP cost per unit × quantity used in the recipe).
Sample recipe card layout:
| Ingredient | Quantity | EP Unit Cost | Line Total |
|---|---|---|---|
| Ribeye (trimmed, cooked) | 8 oz | $19.05/lb | $9.53 |
| Roasted potatoes | 4 oz | $1.20/lb | $0.30 |
| Seasonal vegetables | 3 oz | $2.80/lb | $0.53 |
| House vinaigrette | 1 oz | $0.14/oz | $0.14 |
| Subtotal | $10.50 |
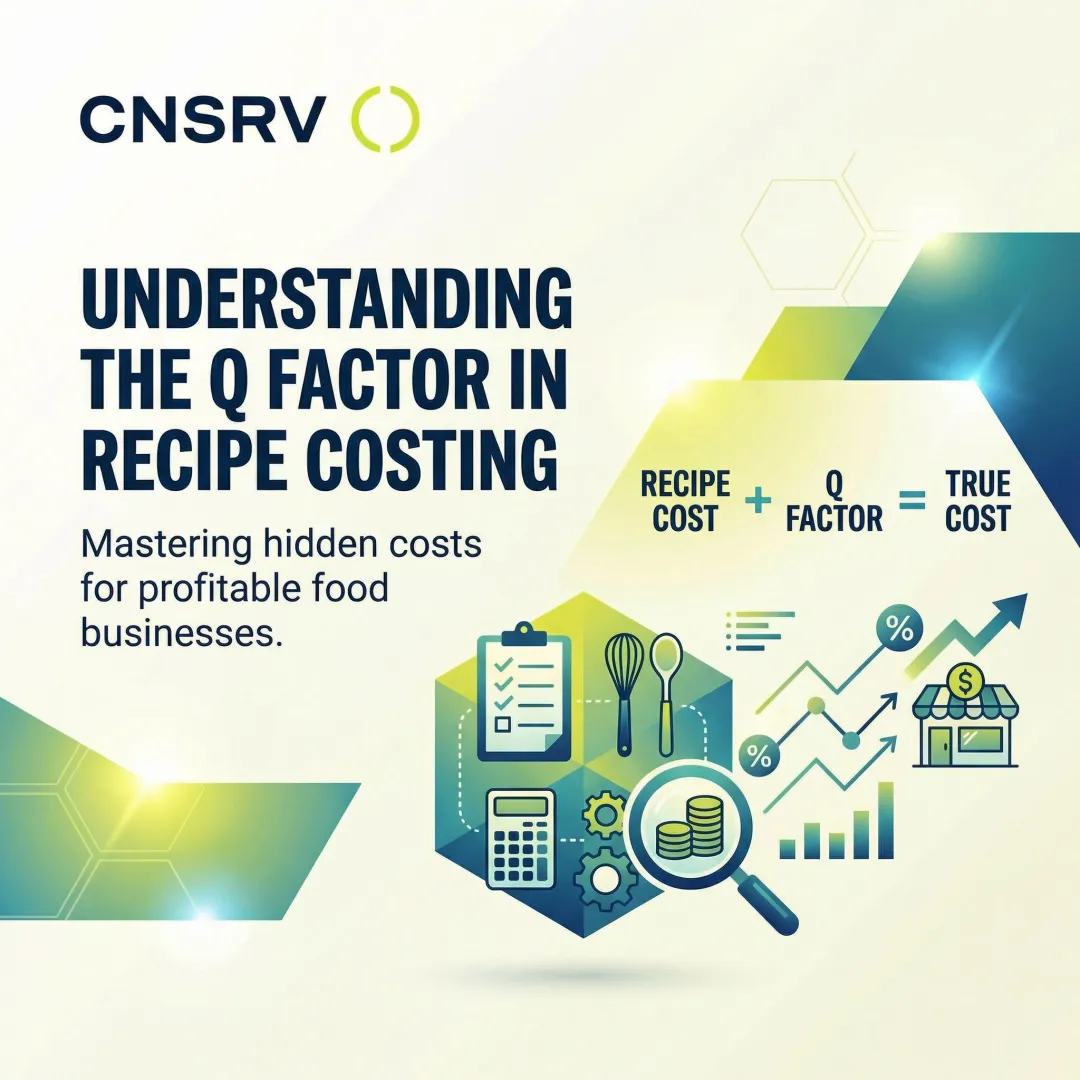
Now add the Q-Factor (sometimes called the Spice Factor)—a percentage add-on to account for small, hard-to-track ingredients like salt, oils, garnishes, and spices.
Q-Factor formula:
- Q-Factor % = (Total Cost of Untracked Ingredients ÷ Total Food Cost) × 100
- Final Plate Cost = Total Recipe Cost × (1 + Q-Factor %)
A Q-Factor of 1% to 5% of total food cost is standard for most operations, though kitchens with heavy condiment or garnish use can run as high as 10%. To determine your specific Q-Factor, review invoices for spices, oils, and other untracked items over a month, divide by your total food cost, and convert to a percentage.
Example: If your Q-Factor is 4%, the final plate cost becomes:
- $10.50 × 1.04 = $10.92

That $0.42 gap looks minor on one plate. Across 500 covers a week, it's $210 in untracked cost—every week.
Key Variables That Affect Recipe Cost Accuracy
Two kitchens following the same process can still get different results depending on how well they control these four key variables.
Ingredient Yield Percentage
Yield varies by ingredient quality, supplier, season, and prep technique. A lower-quality protein may yield significantly less usable product than a premium cut at the same AP price, making its true cost higher. Yield must be tested per ingredient and updated when sourcing changes.
Using an assumed yield instead of a tested one causes per-dish costs to be understated. A 5% yield variance on a high-cost protein can shift your food cost percentage by a full point or more — enough to quietly erode margins on your best-selling dishes.
Portion Size Consistency
Portion size is a multiplier. Even a small deviation—an extra half-ounce of protein per plate—multiplied across hundreds of covers per week creates meaningful cost variance. This is why standardized recipes and portioning tools (scales, scoops, ladles) are essential.
Inconsistent portioning makes recipe cost calculations unreliable even when the math was done correctly at the outset. Train your team to portion by weight, not by eye.
Supplier Price Fluctuations
Ingredient costs—especially proteins, produce, and commodities—change frequently. A recipe costed three months ago may now have a significantly different plate cost if input prices have moved.
Current commodity data from January 2026 shows extreme divergence: coffee prices surged +24.7% year-over-year, beef rose +10.4%, while eggs dropped -34.2% following recovery from avian flu spikes. Pork increased 7.6%, while fresh vegetables and fruit remained relatively stable.

Operators using stale pricing in their recipe cards may be pricing menu items below actual cost without realizing it. Review recipe costs at minimum seasonally — ideally whenever a key supplier raises prices. Digital tools that update costs in real time eliminate this lag entirely.
Hidden Operational Costs
Beyond ingredient costs, certain operational activities carry a real cost that rarely appears on recipe cards. Water usage for defrosting frozen proteins is a prime example.
For kitchens that regularly thaw proteins under running water, both the water cost and time cost contribute to the true per-dish cost of protein-heavy recipes. Research shows the running water method can consume 187 to 387 gallons per thawing session. With commercial water and sewer rates reaching approximately $27 per 1,000 gallons in metros like Washington D.C., high-volume defrosting adds hundreds — sometimes thousands — of dollars annually to operational costs.
Closed-loop defrosting systems like the CNSRV DC:02 use 98% less water than traditional faucet methods and cut defrost time in half. That translates directly into lower utility bills and more accurate cost modeling on protein-intensive menu items.
Common Mistakes Operators Make When Costing Recipes
Using AP Cost Instead of EP Cost
Pricing recipes based on what you paid at purchase, without accounting for waste, trim, and cooking loss, systematically understates true food costs. This is the single most common and costly error.
A ribeye purchased at $12/lb but yielding only 63% has a true cost of $19.05/lb. Ignoring this difference means every ribeye dish you sell is costed incorrectly by nearly $7 per pound. Across a menu and across volume, this error compounds into significant margin erosion.
Always calculate yield percentage and convert AP cost to EP cost before building your recipe card.
Ignoring Sub-Recipe Costs
Batch-prepared items like stocks and sauces are often treated as "free" or lumped into a vague overhead category instead of being costed per unit and applied to each dish that uses them. That omission hides real costs across every dish that uses them.
A house-made demi-glace that costs $2.50 per ounce isn't free just because you made it in-house. Every dish using 2 oz of that sauce carries a $5.00 cost that must appear on the recipe card.
Costing Once and Never Updating
A recipe cost is only accurate as of the day it was calculated. Operators who set menu prices based on one-time costing and don't revisit them as supplier costs change are slowly eroding their margins without seeing it in real time.
Commodity prices shift fast — beef and coffee have both seen double-digit year-over-year increases in recent cycles. Static recipe costs go stale quickly. Establish a review cadence and update prices before the gap becomes a crisis:
- Quarterly minimum: Review all recipe costs against current supplier invoices
- Monthly: Prioritize high-volatility proteins, oils, and dairy
- Incrementally: Adjust menu prices in small steps rather than waiting for a large correction
Skipping the Q-Factor
Small ingredients — salts, oils, spice blends, herb garnishes — seem negligible per plate but add up materially across volume. Industry data suggests these untracked items represent 1% to 5% of total food cost. On a $30,000 monthly food spend, that's $300 to $1,500 in unallocated costs per month.
For a plate with $10.00 in prime ingredients, a 4% Q-Factor adds $0.40 per cover. That's $40 missing from every 100 plates sold — and it's fully recoverable just by building the number in.
Recipe Costing Tools: Spreadsheets vs. Digital Platforms
Spreadsheets can work for recipe costing but carry significant limitations. They require manual price updates, are prone to formula errors, don't automatically reflect yield changes, and become difficult to maintain across a menu with many items or multiple locations. Studies indicate that 88% of business spreadsheets contain errors, and a single decimal error can increase calculated food costs by 200%.
Modern recipe costing software and integrated restaurant management platforms solve these problems. When evaluating platforms, look for these capabilities:
- Auto-updates ingredient prices directly from supplier invoices
- Calculates EP costs based on yield inputs
- Links sub-recipes to parent recipes for accurate batch costing
- Scales recipes and syncs updated costs across multiple locations
- Tracks actual vs. theoretical food cost variance in real time
- Includes built-in yield libraries for common ingredients

For operators not ready for software, a well-structured spreadsheet still beats back-of-napkin math. Use locked formulas, clearly labeled input fields for AP cost and yield %, and a dedicated column for EP cost per unit.
Essential columns for a recipe costing spreadsheet:
- Ingredient name
- Quantity used (with unit)
- AP cost per unit
- Yield % (tested)
- EP cost per unit (calculated)
- Line total (quantity × EP cost)
- Subtotal, Q-Factor %, and final plate cost
Frequently Asked Questions
What is recipe costing?
Recipe costing is the process of calculating the exact cost of producing one serving of a dish by adding up the edible portion cost of every ingredient used at the portioned quantity. The result is a per-plate cost figure used to set menu prices and evaluate profitability.
How much should I charge for recipe development?
Recipe development pricing is separate from recipe cost calculation. Culinary consultants typically charge $39 to $96 per hour, averaging $46.53/hour. Flat project fees run $200 to $600 per recipe, depending on scope, testing requirements, and whether photography or IP rights are included.
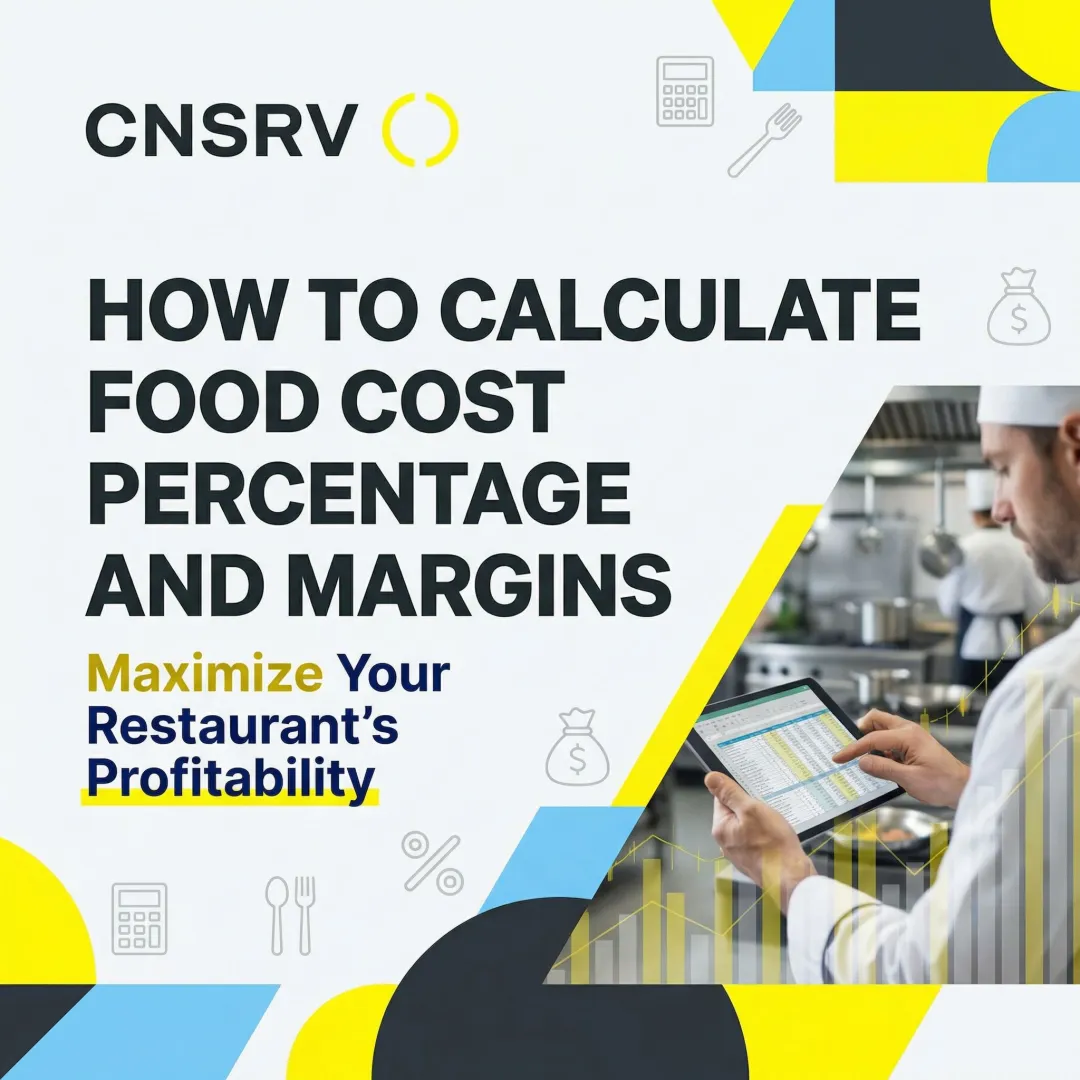
What is the difference between recipe cost and food cost percentage?
Recipe cost (or plate cost) is the actual dollar amount it costs to produce one serving. Food cost percentage expresses that cost as a proportion of the menu price: (Plate Cost ÷ Menu Price) × 100. Both numbers are needed: plate cost sets the floor, and food cost percentage measures how efficiently that dish is priced.
How do I calculate ingredient yield for recipe costing?
Run a yield test: weigh the ingredient before prep (AP weight), weigh after trimming or processing (EP weight), then calculate Yield % = (EP Weight ÷ AP Weight) × 100. Use that percentage to convert AP cost to true EP cost by dividing AP cost by the yield percentage in decimal form.
How often should I update my recipe costs?
Review recipe costs at minimum seasonally, but ideally whenever a key supplier raises prices. Proteins and produce are most volatile. Digital platforms with automatic price syncing eliminate manual re-costing cycles entirely.
What hidden costs are most commonly missed in recipe costing?
The most commonly overlooked costs are: small-quantity ingredients covered by the Q-Factor (spices, oils, garnishes), sub-recipe components treated as free, and overhead tied to ingredient prep — such as the water and labor cost of defrosting frozen proteins under a running faucet.